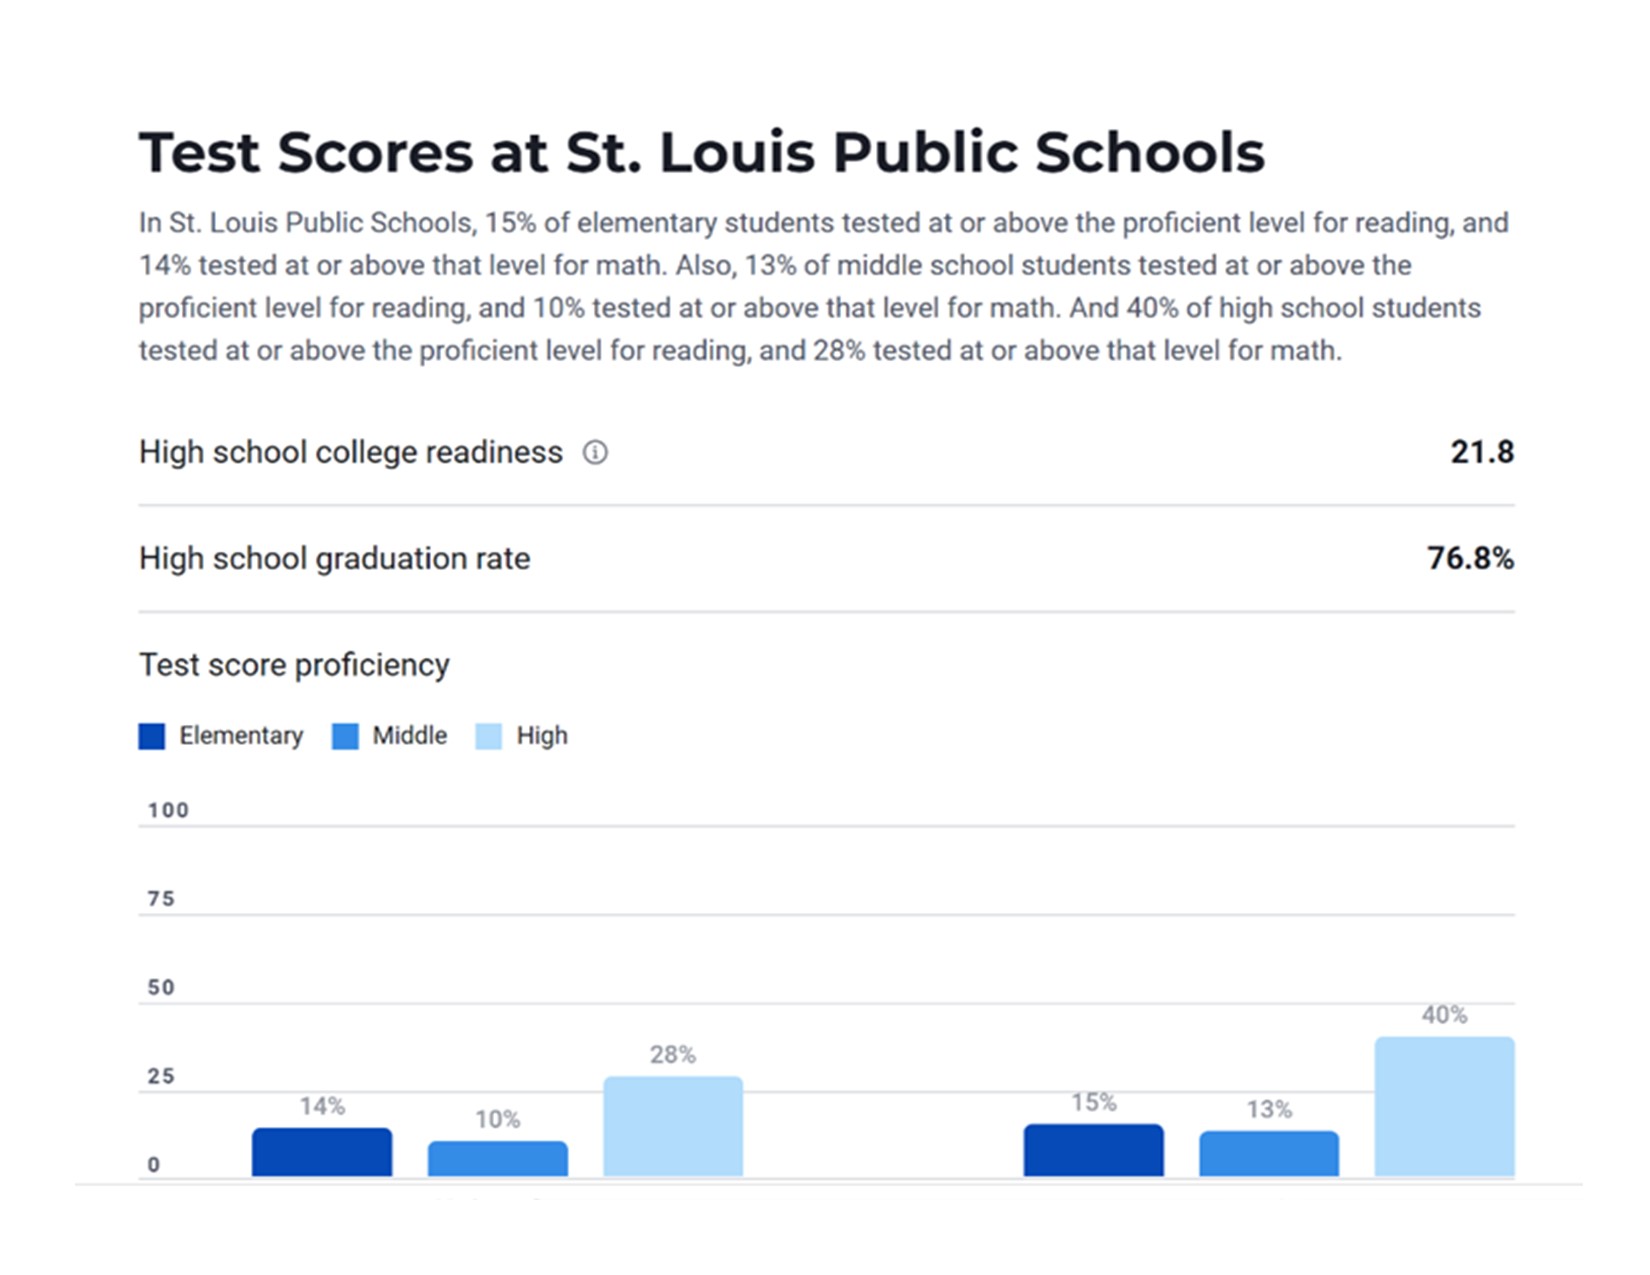
Gaps among racial and socioeconomic groups have remained consistent from year to year. Asian students testing proficient in all subjects last spring totaled 57%. Black students had the lowest scores of any racial group, with 17% proficiency. White students, who make up more than two-thirds of Missouri’s public-school enrollment, tested at 47% proficiency compared with 50% three years ago.
Source: St. Louis Post-Dispatch, Missouri student test scores fail to rebound in the second school year of the pandemic August 16, 2022

Short and Sweet Headlines are Best!
St. Louis Public Schools population statistics
- The student body at the schools served by St. Louis Public Schools is 12.9% White, 77.8% Black, and 9.3% Other.
- 49% of students are female, and 51% of students are male.
- 4% of students are eligible to participate in the federal free and reduced-price meal program.
- Source: Us News Education
Why St. Louis City?
|
Stats for 2020-2021 school year |
Elementary |
Middle School |
High School |
|
Minority Enrollment( majority Black) |
87% vs MO 31% |
89% vs MO 30% |
85%(majority Black) vs |
|
Enrollment |
14,241 |
4,593 |
5,674 |
|
# of Schools |
59 |
19 |
19 |
|
Math Proficiency |
11% vs MO 36% |
10% vs MO 34% |
24% vs MO 32% |
|
Reading Proficiency |
17% vs MO 44% |
18% vs MO 43% |
38% vs MO 52% |
|
Graduation Rate |
73% vs MO 90% |
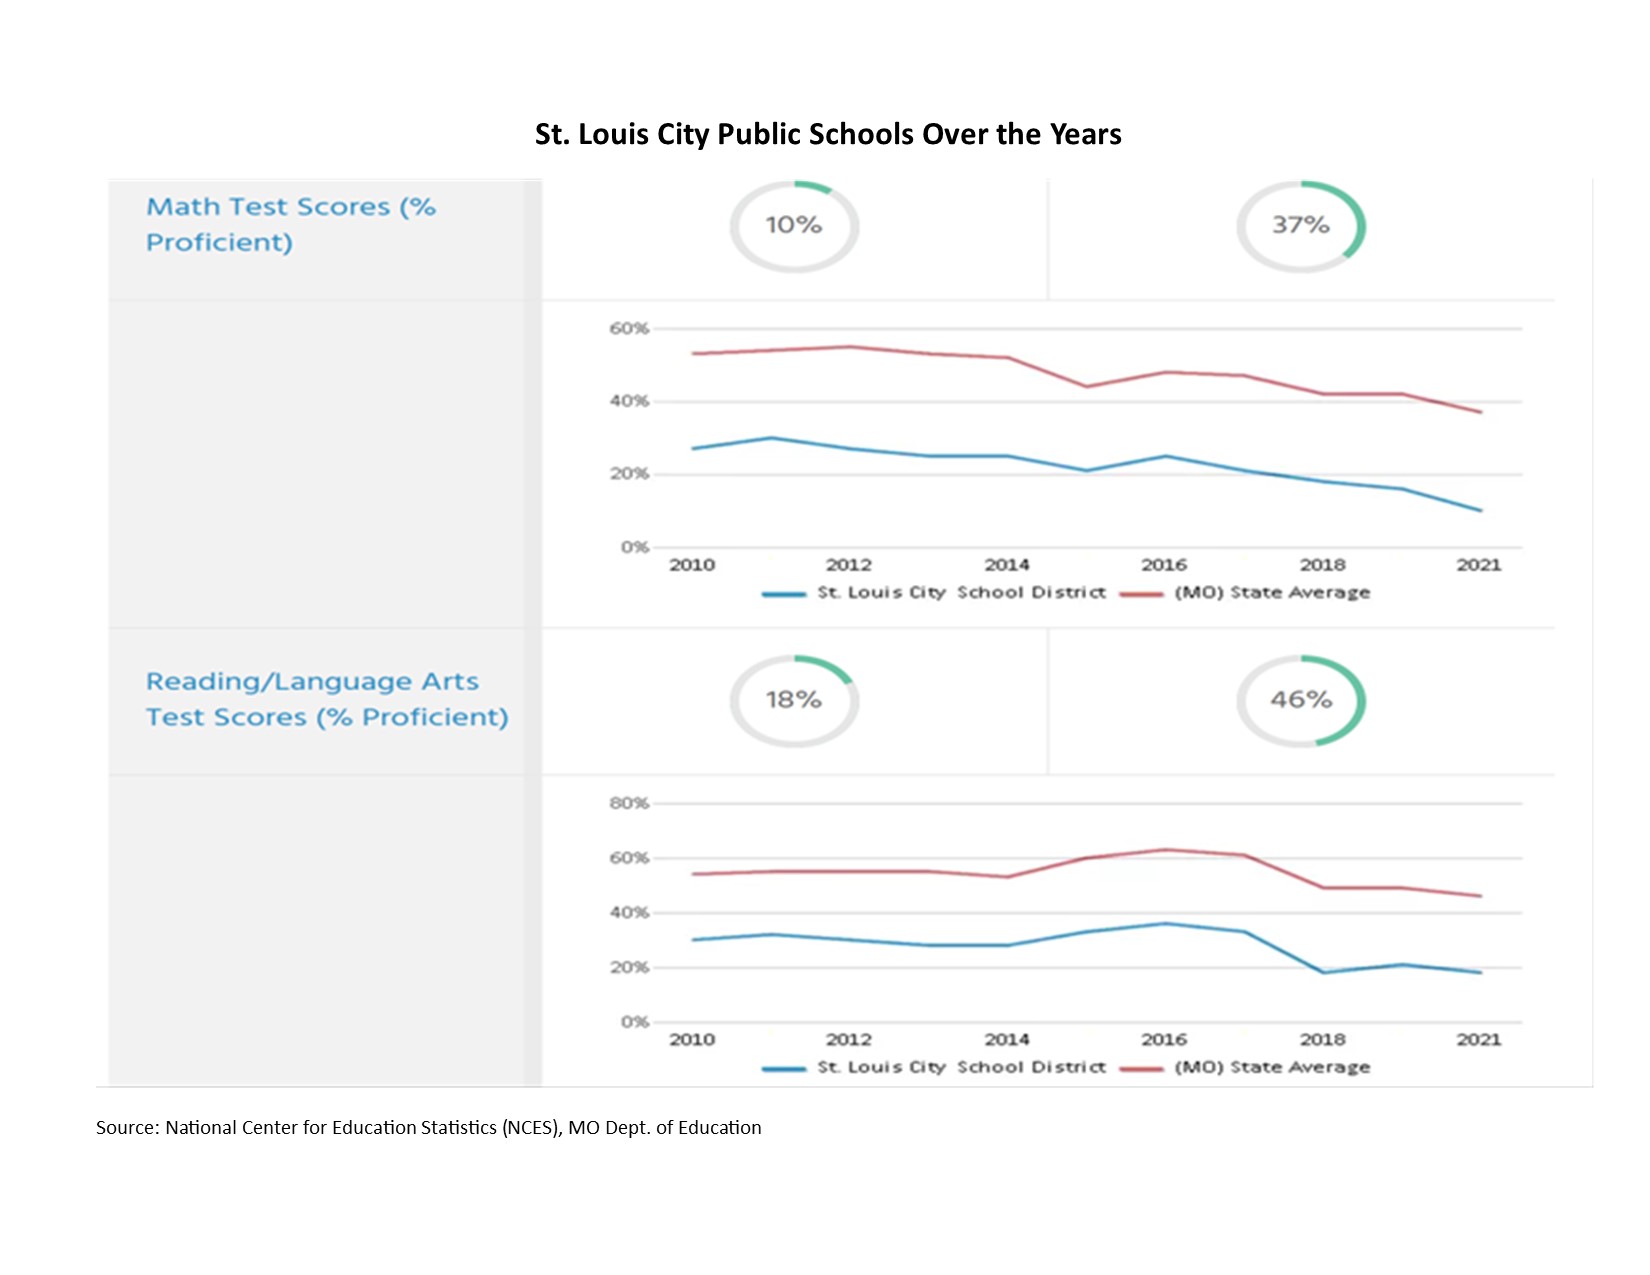
Source: National Center for Education Statistics (NCES), MO Dept. of Education
St. Louis City Public Schools Over the Years

Why North County?
|
Riverview Gardens School District |
|||
|
Elementary |
Middle School |
High School |
|
|
Minority Enrollment( majority Black) |
99% vs MO 31% |
99% vs MO 30% |
99% vs MO 30% |
|
Enrollment |
3,741 |
1,254 |
1,161 |
|
# of Schools |
11 |
2 |
1 |
|
Math Proficiency |
3% vs MO 36% |
2% vs MO 34% |
2% vs MO 37% |
|
Reading Proficiency |
9% vs MO 44% |
11% vs MO 43% |
18% vs MO 46% |
|
Graduation Rate |
61% |
||
|
Hazelwood School District |
|||
|
Elementary |
Middle School |
High School |
|
|
Minority Enrollment( majority Black) |
99% vs MO 31% |
88% vs MO 30% |
85% vs MO 28% |
|
Enrollment |
11,115 |
4,030 |
4,898 |
|
# of Schools |
26 |
6 |
3 |
|
Math Proficiency |
11% vs MO 36% |
14% vs MO 34% |
12% vs MO 32% |
|
Reading Proficiency |
25% vs MO 44% |
26% vs MO 43% |
33% vs MO 52% |
|
Graduation Rate |
80% |
||
Stats for 2020-2021 school year by District
